

Austin Housing Market 2025: Year-to-Date Inventory Changes Revealed
Published | Posted by Dan Price
Austin Area Housing Inventory Trends: Top and Bottom Five Cities for Year-to-Date Changes in 2025
The housing market in the Austin area has experienced notable shifts in 2025, with months of inventory serving as a critical indicator of market dynamics. Months of inventory measures how long it would take to sell all available homes at the current sales pace, offering insight into whether a market favors buyers or sellers. Based on data from Team Price Real Estate’s “Months of Inventory History” report, revised on April 28, 2025, this article examines the top five Austin-area cities with the highest year-to-date increases in months of inventory from January 2025 to April 2025, as well as the five cities with the smallest or negative changes. Covering 30 cities in the Austin region, including Austin, Cedar Park, and Driftwood, this data-driven analysis highlights key trends in the local housing supply.
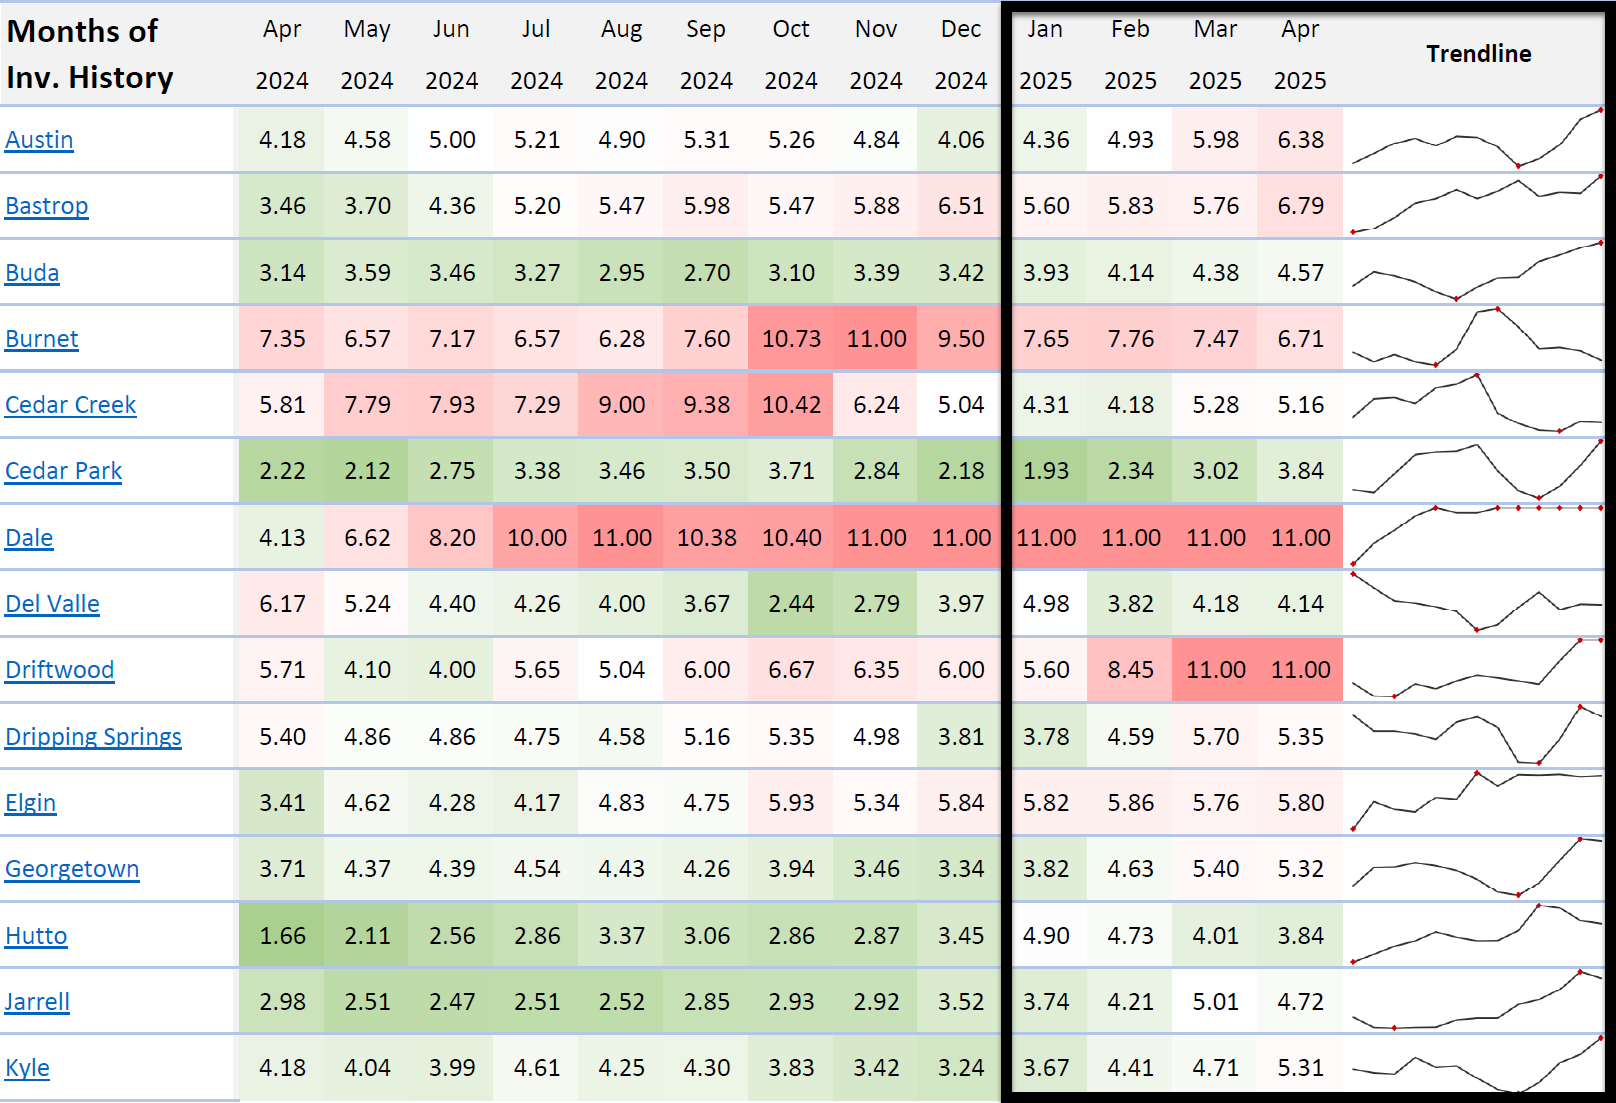
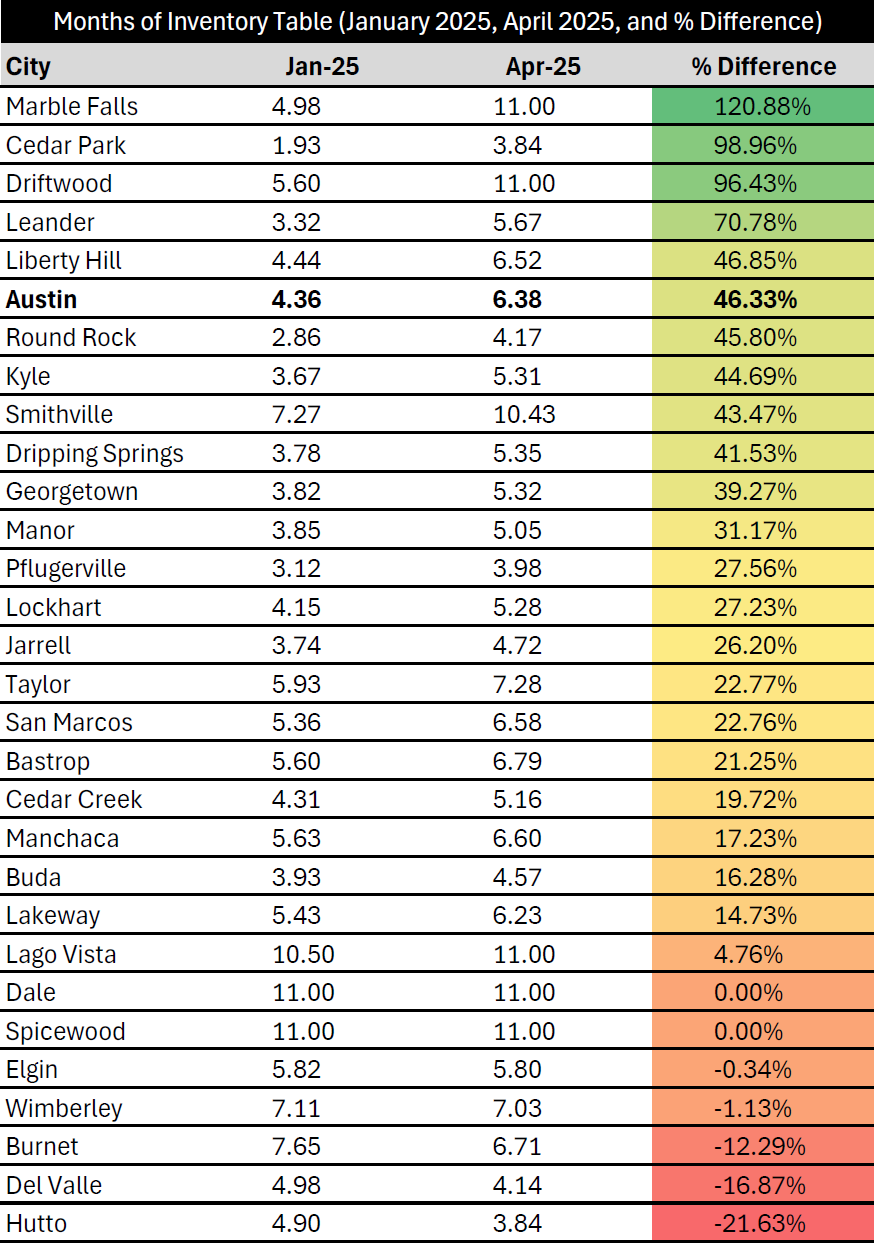
Cedar Park stands out with the highest year-to-date increase in months of inventory among the Austin-area cities. In January 2025, Cedar Park had 1.93 months of inventory, which jumped to 3.84 months by April 2025, a 98.96% increase. This near-doubling of inventory suggests a significant rise in available homes, potentially driven by new construction or a slowdown in buyer activity. Driftwood follows closely, with inventory rising from 5.60 months in January 2025 to 11.00 months in April 2025, reflecting a 96.43% increase. This sharp growth indicates a shift toward a more balanced or buyer-friendly market in this smaller community.
Leander ranks third, with a 70.78% increase in months of inventory, moving from 3.32 months in January 2025 to 5.67 months in April 2025. This change points to an expanding supply of homes, which could ease competition for buyers in this fast-growing suburb. Liberty Hill saw a 46.85% increase, with inventory growing from 4.44 months to 6.52 months over the same period. Completing the top five is Austin itself, where months of inventory rose from 4.36 months in January 2025 to 6.38 months in April 2025, a 46.33% increase. These increases across Cedar Park, Driftwood, Leander, Liberty Hill, and Austin suggest a regional trend of growing housing supply, potentially creating more opportunities for buyers.
On the other end of the spectrum, several Austin-area cities experienced minimal or negative changes in months of inventory. Dale and Spicewood both recorded no change, maintaining a steady 11.00 months of inventory from January 2025 to April 2025, resulting in a 0.00% difference. This stability indicates a consistent balance between supply and demand in these markets. Elgin saw a slight decline, with inventory dropping from 5.82 months to 5.80 months, a -0.34% change, suggesting a minor tightening of supply. Wimberley also experienced a small decrease, with inventory falling from 7.11 months to 7.03 months, a -1.13% change. The largest decline occurred in Del Valle, where months of inventory decreased from 4.98 months to 4.14 months, a -16.87% change, indicating a faster sales pace relative to available homes.
The contrasting trends in the Austin area highlight the diversity of its housing market in 2025. Cities like Cedar Park and Driftwood, with their significant inventory increases, may offer buyers more choices and less competition, while areas like Del Valle and Elgin, with stable or decreasing inventory, could remain more competitive for purchasers. The data also underscores Austin’s position as a key market, with its 46.33% inventory growth signaling a shift toward a more balanced market. These changes reflect broader dynamics in the Austin area, where factors like new development, economic conditions, and buyer preferences shape the housing landscape.
For those tracking the Austin-area housing market, these inventory trends provide valuable insights. Cities with rising inventories, such as Cedar Park, Driftwood, and Leander, may see slower price growth as supply increases, while areas with stable or declining inventories, like Del Valle and Spicewood, could maintain stronger seller advantages. By understanding these year-to-date changes, homebuyers, sellers, and real estate professionals can make informed decisions in a dynamic and evolving market.
FAQ Section
What is months of inventory in real estate?
Months of inventory measures how long it would take to sell all homes currently listed for sale at the current sales pace. For example, Austin’s 6.38 months of inventory in April 2025 means it would take over six months to sell all available homes if no new listings were added. A lower number indicates a seller’s market, while a higher number suggests a buyer’s market.
How does a high months of inventory affect homebuyers in the Austin area?
A high months of inventory, like Driftwood’s 11.00 months in April 2025, typically means more homes are available, giving buyers more choices and potentially less competition. This can lead to slower price increases or more negotiating power for buyers, as seen in cities like Cedar Park with a 98.96% inventory increase.
Why did some Austin-area cities see no change in months of inventory in 2025?
Cities like Dale and Spicewood maintained a steady 11.00 months of inventory from January to April 2025 due to a balance between new listings and sales. Stable inventory suggests consistent demand relative to supply, often seen in less volatile or smaller markets within the Austin area.
Request Info
Have a question about this article or want to learn more?
